Blog
Understanding the Importance of Real-Time Analytics in the Modern Clinical Laboratory

January 9, 2026

We all know that pathology groups and clinical laboratories (molecular, reference, and specialty) collect a mountain of data daily. From patient demographics to test results and everything in between, data is collected as specimens are accessioned and processed, and lab reports are generated and distributed. This data is typically collected and stored securely within a laboratory information system (medical LIS software).
Traditionally, laboratory information systems have operated as excellent clinical and pathology lab software solutions for collecting and storing lab informatics, but not for providing easily discernible real-time data to aid management with the simple push of a button.
Fortunately, that status is changing as modern and full-featured LIS system software now supports data mining, a process by which a lab can analyze its internal data to make more informed business decisions and improve lab operations (efficiency and productivity).
Discover More: Best LIS Software - Maximize Growth With Cutting Edge Pathology Lab Management Software
Data Mining and Real-Time Analytics Are Redefining Laboratory Operations
Data mining supported by modern, best-in-class laboratory information system software has become increasingly important as organizations across all testing disciplines seek to strengthen both technical and financial performance without further inflating operating costs. Rather than relying solely on external fixes or additional staffing, today’s most effective lab leaders are turning inward, leveraging advanced laboratory information system technology to activate the data they already collect every day.
By using LIS-driven analytics, lab directors and managers can first gain clear, real-time insight into operational performance and then translate that insight into targeted actions that improve efficiency, productivity, and financial outcomes.
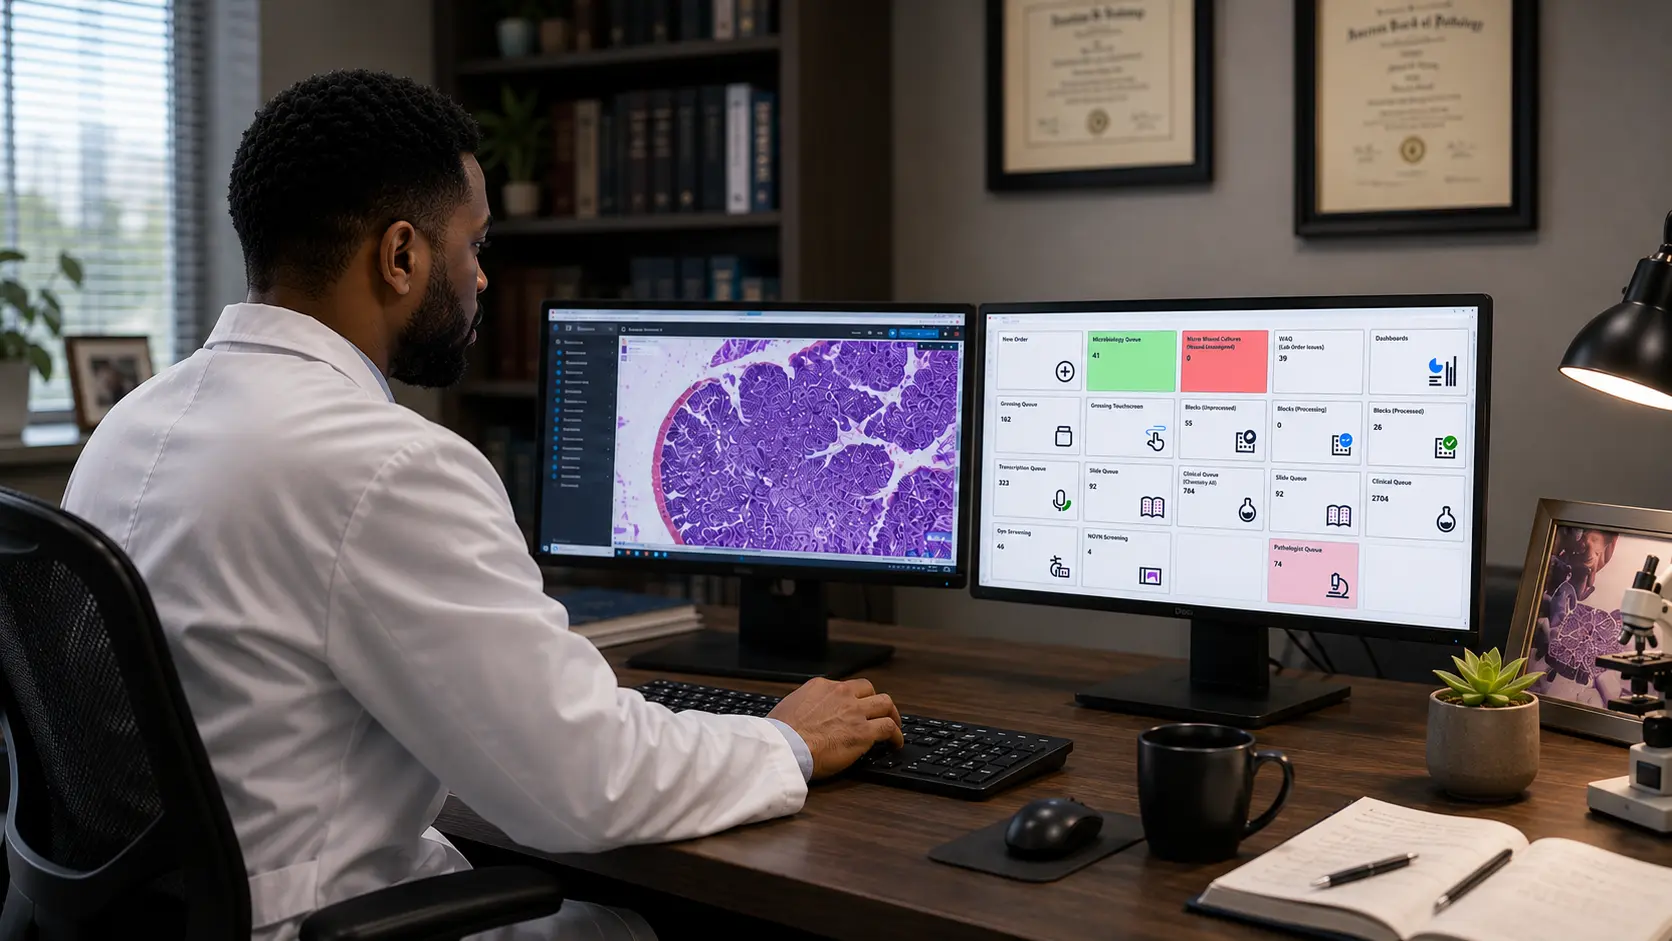
With the importance of data mining and real-time analytics established, the next step is understanding how this information is presented and consumed. That’s where widgets and dashboards come into play. Widgets are small, purpose-built applications that filter and surface specific real-time laboratory data. Dashboards are configurable visual views that organize these widgets by role, user, or department, making critical information immediately accessible and actionable.
Industry Insights: Laboratory Information Systems and Their Key Role in Lab Data Analytics
Real-Time Analytics Powered by the LigoLab Informatics Platform
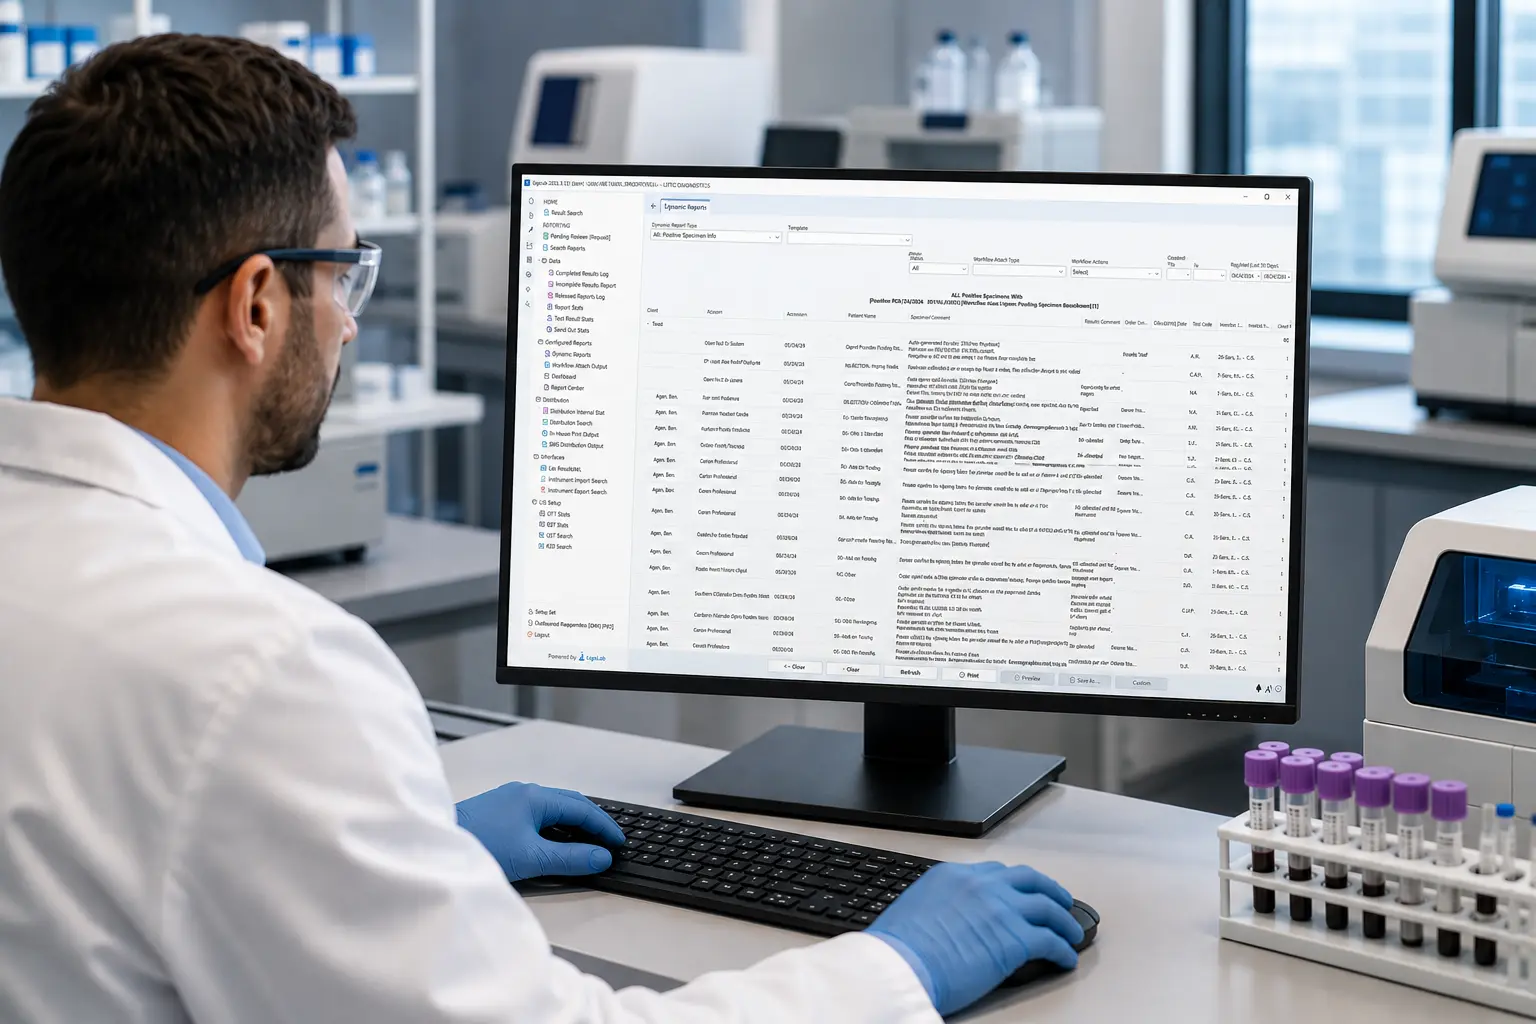
The LigoLab Informatics Platform exemplifies how modern clinical and pathology lab reporting software delivers real-time, actionable analytics. The all-in-one platform unifies laboratory information system (LIS) functionality with embedded laboratory billing and revenue cycle management (lab RCM), providing a single environment for both operational and financial insight.
At the core of this capability is LigoLab’s flexible dashboard engine, which enables platform administrators to configure a wide range of dashboard widgets, including tables, pie charts, bar graphs, and line charts. These widgets can be built using out-of-the-box statistical reports, custom scripting, or custom SQL queries, enabling labs to tailor analytics to their specific workflows, priorities, and performance goals.
“Once configured, all LIS system users can add pre-built widgets to their dashboards, choosing from hundreds of available widgets and layouts within the platform,” said Allison Still, LigoLab’s LIS Product Manager.
Below are examples of configurable dashboard widgets available within the LigoLab platform.


Why LIS System Data Mining Has Shifted From a Nice-to-Have to a Mission-Critical Capability
Often, as technology advances, an application that began as a “nice to have” can quickly become a “need to have.” That’s the case with data mining from laboratory information system software.
To learn more, we spoke with Joseph Guido, an Anatomic Pathology consultant with deep expertise in advanced clinical and pathology reporting software, and firsthand insight into how best LIS systems, delivered by leading LIS software vendors, help laboratories eliminate operational gaps and scale efficiently.
“Lab operators want to see real-time reporting by feeding data into laboratory information systems with this type of functionality,” he said. “It’s becoming a standard across the industry. Everyone wants to be able to mine their LIS system database for insights into their operations, be it from a high level or a more granular perspective.”
Guido continued by suggesting that the sky is the limit for lab informatics with a modern clinical and pathology information system, as the lab and the LIS company collaborate to refine the design that best represents the data graphically.
“Generally, most dashboard widgets start with a conversation between the lab and LIS system developers. It can be as simple as a design on a piece of paper submitted to the lab vendors' development team,” Guido said.
Discover More: Leveraging LigoLab for Optimal Return on Investment - An LIS System Guide for Lab Directors
Practical LIS System Applications for Today’s Medical Lab
As shown in the examples above, dashboard widgets provide a snapshot of the lab’s efficiency and productivity while enabling lab directors and managers to identify potential issues and take action before it’s too late.
For instance, dashboard widgets can assist client services by tracking accounts and identifying negative trends.
“With this LIS lab tool, management can be alerted to any significant change in volume over a given amount of time with a client,” Guido said. “It’s better to know of a problem in real-time rather than finding out about an issue and an unhappy client a month later. With real-time data available to the Client Services team, they can proactively pick up the phone, figure out the issue, and resolve it.”
Here are a few other scenarios where dashboard widgets can make a positive difference in clinical and pathology lab management:
- Sample Tracking Status: A widget can be created to track the status of each sample from order inception to specimen processing, to reporting. In this scenario, the lab is aware of the number of specimens processed and the time needed to complete each step in each testing workflow. If bottlenecks are identified, adjustments can be made.
- Turnaround Time: A widget can be created to track the start and end times for each test or assay run by the lab. The data gathered can then be compared with target times. If a test consistently takes longer to complete than expected, the lab can drill down into the data and find out why.
- Quality Control: A widget can be created to track quality control metrics, alerting lab managers to any potential issue with test accuracy long before it can negatively impact patient care.
- Equipment Maintenance: A widget can be created to track the status of laboratory equipment and identify when maintenance may be needed. Properly maintained and serviced equipment reduces downtime and improves efficiency.
- Resource Utilization: A widget can track data on test volumes to identify times when human resources may be overburdened or underutilized, allowing lab managers to adjust staffing as needed.
Case Study: OnePath - Transforming Pathology Lab Management Through Digital Innovation
Using Dashboard Analytics to Strengthen Laboratory Revenue Cycle Management Performance
Laboratory revenue cycle management data is another area where dashboard widgets can positively impact productivity and revenue. By capturing key lab RCM metrics and analyzing them, the lab billing department can be alerted to any discrepancies affecting days in accounts receivable, the net collection rate, and the denial rate.
Here are a few other examples where tracking metrics with dashboard widgets can positively affect the laboratory billing process:
- Insurance Claims: Dashboard widgets can be used to monitor the status of insurance claims (including the number of claims submitted and the number of claims denied), plus the average time it takes to receive payment.
- Charge Capture: Dashboard widgets can help labs monitor charge capture rates (the percentage of billable services) and stop revenue leakage.
- Pricing: Dashboard widgets can also be used to monitor services, such as the average reimbursement rate for each test on the test menu. This information can help labs adjust pricing strategies to be more competitive and maximize revenue.
Get Insight: Six Reasons Why You Should Choose an Integrated Laboratory Billing Solution for Your Medical Lab
Creating Customized Widgets in LigoLab’s Dynamic LIS System Platform
Now that we’ve demonstrated the importance of dashboard widgets, let’s talk about how long it takes to go from a concept to a reality in LigoLab’s agile lab information system environment.
According to Still, the project turnaround time is relatively quick.
“Once mapped out, the actual build goes fast,” she said. “Our experienced developers first take the time to understand the project, and then the build starts. Usually, there’s a bit of back and forth between the lab and the LIS developer before the design is finalized and added to the lab’s production environment.”
Industry Insights: Bridging the Gap in Modern Laboratories - Why a Comprehensive Digital Platform Outperforms a Basic Lab Information System
Advanced Laboratory Information System Software: Modernize and Digitize Lab Operations
If you are ready to learn more about how dashboards and LigoLab’s all-in-one medical LIS and lab RCM platform can help your clinical or pathology lab modernize and grow efficiently, click below and schedule a personalized LIS software demonstration with a LigoLab product expert.